After a great journey filled with data and insights, the time has come for me to say goodbye. I have decided to sunset Analytics Buddy, and as of today, the app will no longer be available or supported.
Analytics Buddy used the previous version of Google Analytics for some of its data and I found it impractical to port the app over to use Google Analytics 4.
I am very grateful that you gave Analytics Buddy a try and I hope our paths cross again in the future, with new ventures and fresh opportunities. I am researching other app ideas and if you have any suggestions for an analytics-focused app, please let me know.
I’m pleased to share a new Data Studio community visualization, called Animated Bar Charts. As the name suggests, it allows you to create a Top 10 List type bar chart and animate it over time.
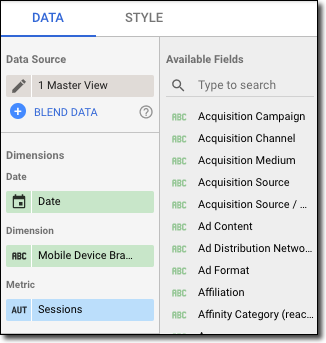
The visualization is built with D3. With Data Studio you can quickly and easily try the visualization with different data. D3 visualizations are often hand-built for a specific dataset, which typically has to be read in as a csv file from a web server. Data Studio takes care of the data loading as you just connect to any data source that Data Studio offers, whether it’s Google Analytics or Google Sheets. You just need a Date, a dimension and a metric you’re interested in. Data Studio helps you out by showing you the fields you can use in the configuration panel:
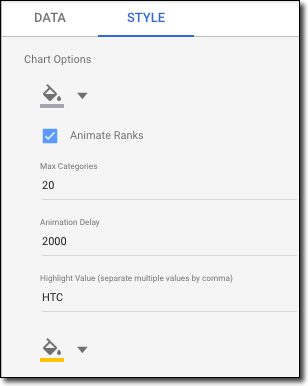
Customize the appearance of the chart and pick your own colors. You can even highlight specific data points to draw the viewer’s attention.
To use visualization in your own reports please check out this data studio report for instructions. Let me know if you use the visualization in any interesting ways or if you have suggestions for improvement.
I’m pleased to announce the launch of our premium Daily Sales and Traffic email. It’s designed for the busy retailer who wants to get a quick summary in your inbox each morning showing you the traffic, number of orders, sales and other key metrics for your store. Take a look at our sample report.
Daily Sales and Traffic Email
Get a convenient email with a summary of activity from your store each morning. The app connects to Google Analytics and allows you to understand both sales and traffic numbers to help you keep track of activity on your store. The email will contain key metrics that are important for running your store. There are four key metrics right at the top to give you a quick summary on a daily basis.
Number of Transactions
Number of daily sessions
Total Gross Sales
Conversion Rate
Sales
Looking for more detail? How about a quick dive into sales metrics. Understand daily, weekly and monthly trends in important selling KPIs including…
Gross Sales
Discounts
Refunds
Shipping
Collected Tax
Traffic
How about traffic? Is your store getting enough visitors? What channels are driving the most sessions? The app pulls the top five traffic sources from your GA account and reports daily, weekly and monthly data to help you understand trends and quickly spot problems.
Conversions
Understand important conversion metrics for your store including Conversion Rate, AOV, Bounce Rate and Time on Site. These metrics are pulled directly from your Google Analytics profile and allow you to quickly understand how your store is doing without having to run multiple reports. Even better, spot drops in conversion rate and stay ahead of potential problems with your site.
Customer Metrics
Still want to know more? How about the number of orders from new customers, repeat customers and trends in new vs returning. Data is available for daily, weekly and monthly trends. How many new customers did you add last month?
Top Products
Finally. Understand the top products that are driving sales for your store. How many did you sell? Focus your attention on the products that make the biggest difference and boost your sales.
The report is available now for all Analytics Buddy users and is free for the first 30 days. Then it’s just $5/month as part of our Analytics Ninja plan.
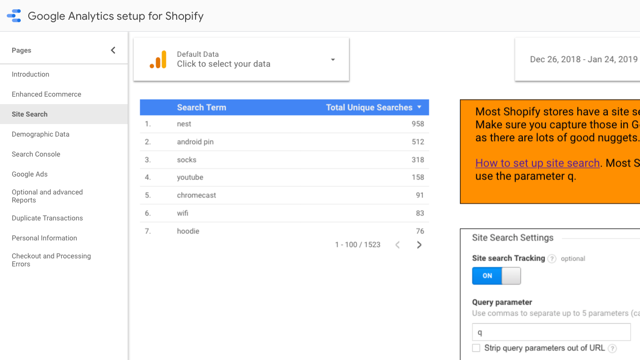
How can you tell if Google Analytics is working properly for your Shopify store? While Shopify makes it very easy to get started, there are a few settings that are not enabled out of the box. To double check your Google Analytics and to highlight some potential issues, we created a Data Studio report for you to make this process very easy.
Access the report or click the thumbnail above to get started. You’ll need to login to the same account you use for Google Analytics. Please note that no data is sent to Analytics Buddy.
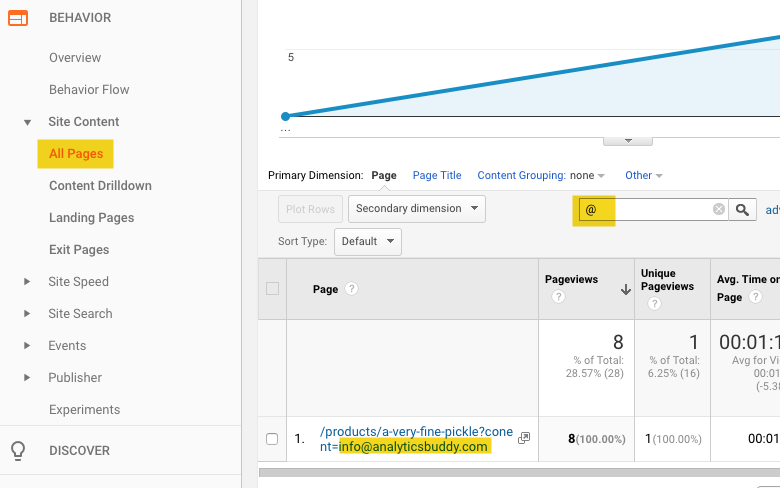
Did you know that it is against the terms and conditions of Google Analytics to send Personally identifiable information (PII) to Google Analytics? This includes information such as email addresses or phone numbers, which can “leak” into your reports without you even knowing it. The easiest way to check if you have PII in Google Analytics is to look in your Site Content > All Pages report. A quick way to find email addresses is to search for @:
If you find such PII you have to remove it at the source, ie the page, script or app that somehow adds the PII to the URL. It is not enough to use a filter in Google Analytics to scrub out PII after it’s in Google Analytics. You have to remove it before it is sent to Google Analytics. Please check with your webmaster and/or app developer on how to remove PII from your URLs.
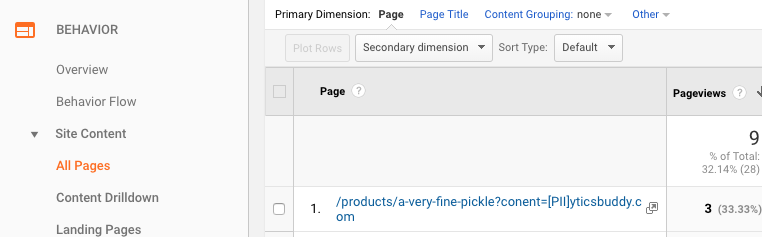
As part of our premium features, Analytics Buddy provides a service that automatically scans all URLs and removes any PII before it is sent to Google Analytics. The nice thing is that it will automatically remove any PII even if you change your site or add apps that may inadvertently introduce PII again.
Here is what the same URL would look like in Google Analytics:
Parts of the email address are replaced by the placeholder [PII] so that it is no longer identifiable.
With the recent introduction of strict GDPR rules you’ll want to make sure you stay compliant and not risk having your Google Analytics account suspended.
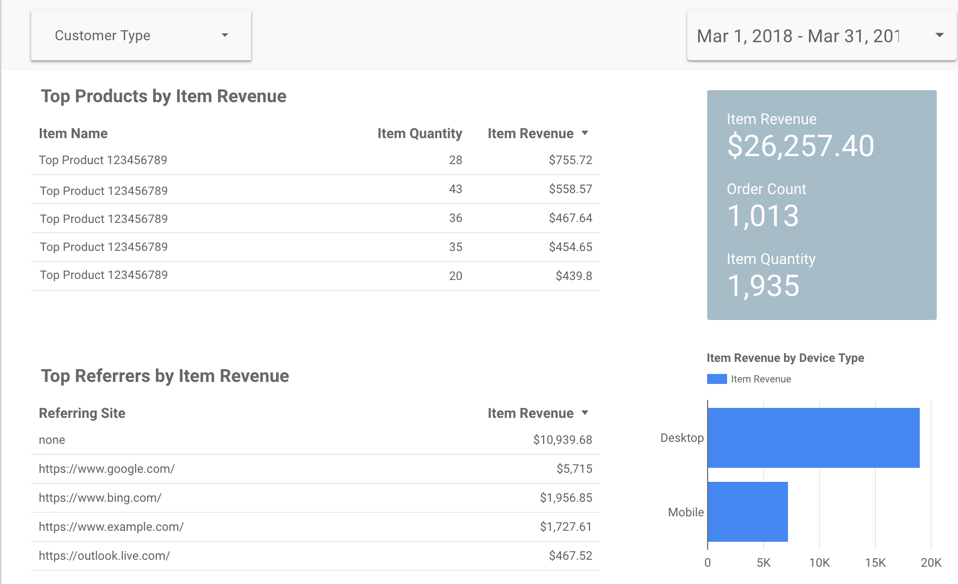
Please take a look at our Data Studio Connector for Shopify. It allows you to create and share Data Studio reports for your Shopify store. Our connector ships with this beautiful template:
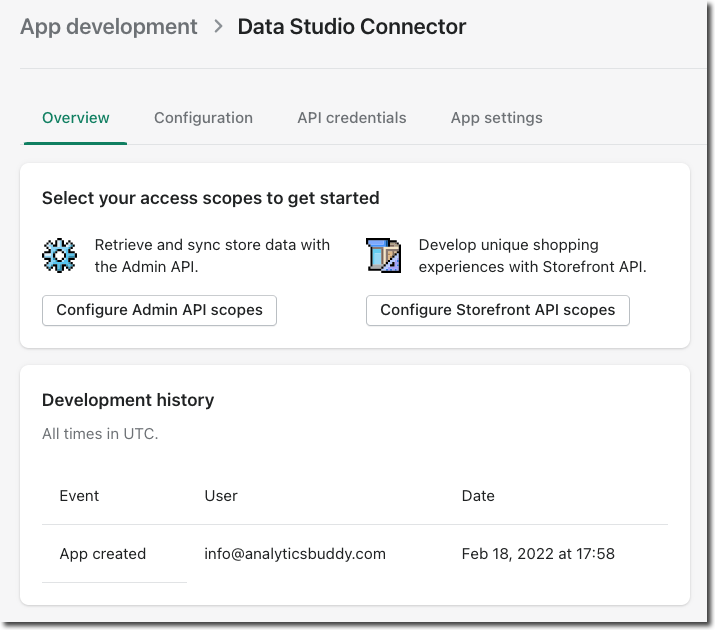
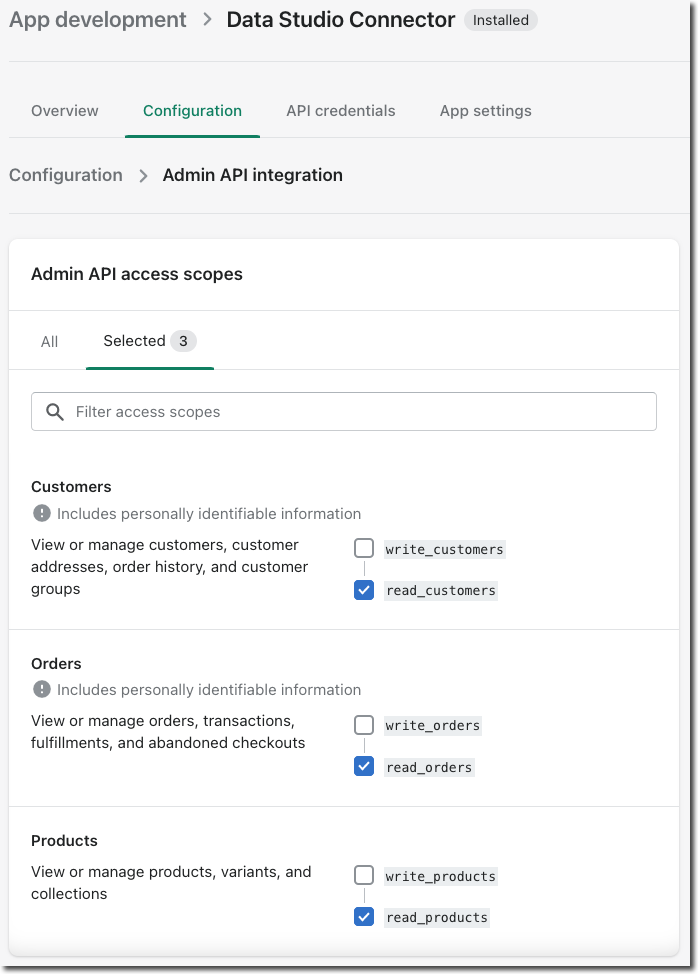
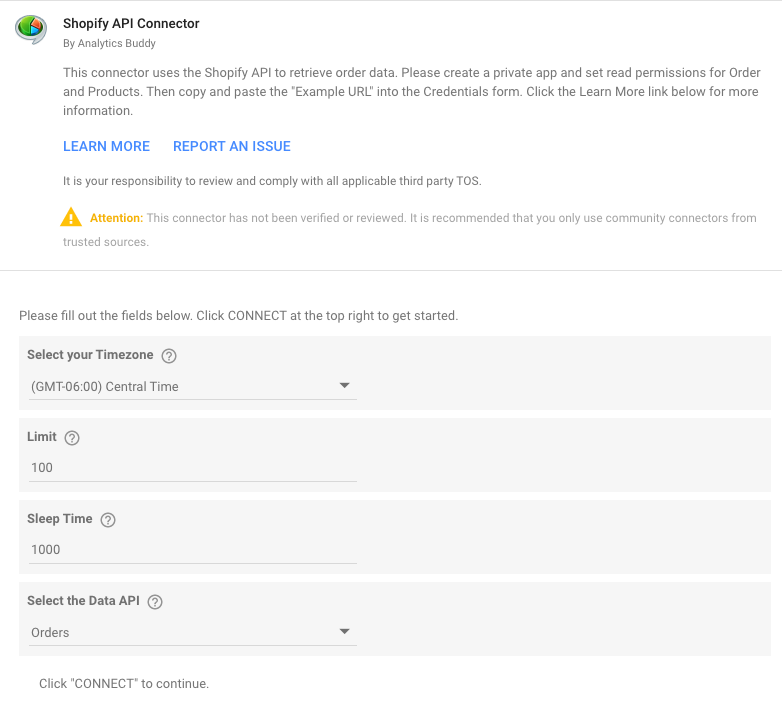
To get started, please create a custom app in your Shopify admin.
Then click on Configure Admin API scopes. Choose Read permissions for Orders, Products and Customers.
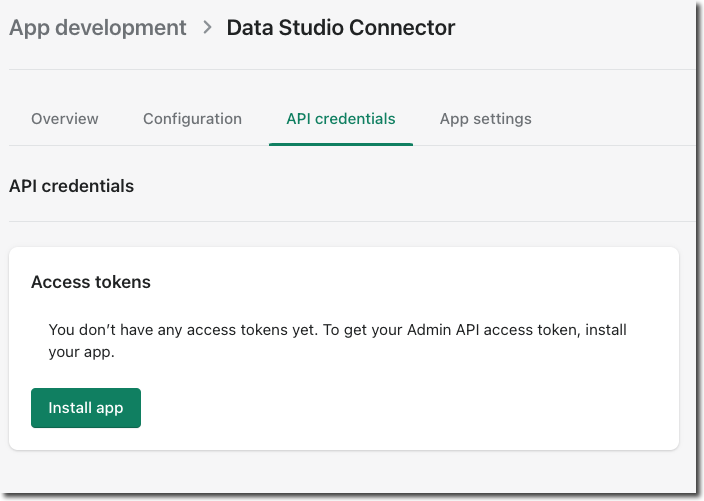
Install the app.
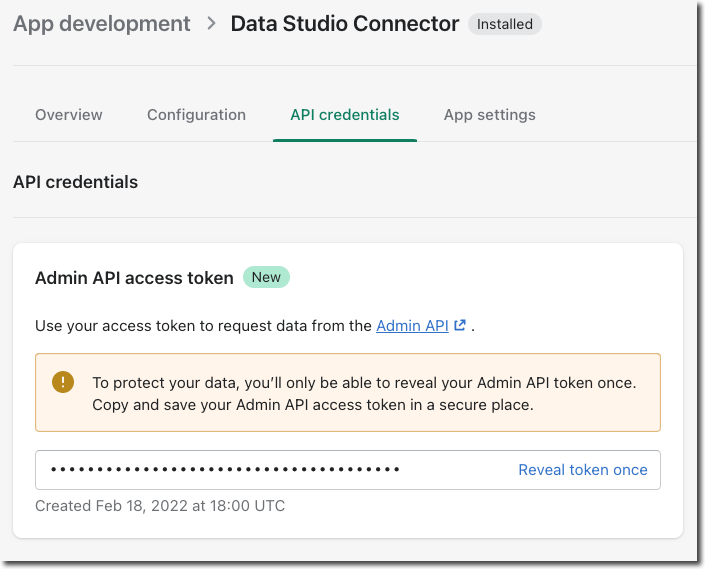
On the next screen you should see the necessary credentials. You’ll need the access token, which will only be displayed once:
The access token should look like this: shpat_…………….. The Data Studio connector uses a Connection URL that uses this access token and your myshopify domain. It should be in this format:
https://shpat_…………….@your-store.myshopify.com
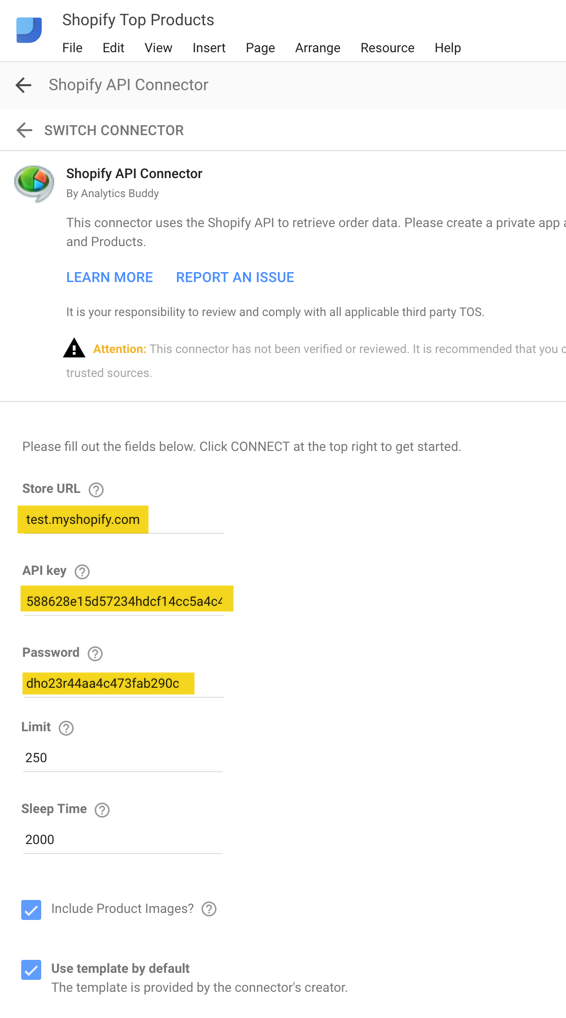
You’ll need this Connection Url when you set up the connector. Next, get the connector by clicking here:
Copy the Connection Url and paste it into the Key field. On the next screen enter your Timezone and choose the API. The options for Limit and Sleep Time are used to control the amount of data and how fast the Shopify API is called. If you have a lot of orders and get errors, you may have to reconnect and increase Limit and Sleep Times.
Viewing multiple Shopify stores in the same report
Did you know that you can easily track multiple stores in the same Data Studio report? After you setup the connector for the first time, Data Studio creates a data source that is based on the connector. You can duplicate that data source in your report and use the Connection URL field to connect the other store you want to track. Rename the copied data source so that you can easily identify it when you setup your report. Repeat this process to connect as many stores as you wish. Here is how to do this in detail:
Combine two scorecards into one using data blending
Once you have two data sources in your Data Studio report you can combine the scorecards into one scorecard, for example in order to calculate the total revenue of both stores. Here’s how you do it:
Other details:
In order to get the data from the Shopify API in the right format, it has to be flattened, like a csv file. Since an order can contain multiple items, each line item will be associated with the same order id, name and other data points. For this reason I did not include Order Total as a metric since it would be associated with each line item and summing it would not make sense.
What does get summed and aggregated is Item Revenue, which is the product of Item Quantity and Item Price. The Item Revenue is likely different than order total because it does not include taxes and shipping costs.
Many data points are not yet included, so if an important metric or dimension is missing, please let me know.
Caching is implemented for product images and icons, but not order data in general.
Sensitive information such as API keys, passwords and order data is never logged.
This connector is not yet published in the gallery.
Update 3/28/2019:
Added more data points: Net Sales, Tax, Shipping, Discounts, Open/closed, Active/Cancelled Orders, Refunds*
*Note that refunds are attached to orders. So if you process a refund today for an order that was placed a few days ago, and you run a Data Studio report for today, the refund will not be listed in the report.
Update 6/7/2019:
Added more data points: Date Hour (so you can break down orders by hour), Basket Size, New Customer ratio, Repeat Customer Ratio
Have you heard all the fuss about machine learning, artificial intelligence and big data? If you think that you already have a ton of data from Google Analytics, you’d be right. But if you think that you can use Google Analytics data to train machine learning models, you’d likely be out of luck. The reason is that Google Analytics aggregates data at the session-level, which is not specific enough for machine learning. You need to be able to get data for each individual session, before it is aggregated.
It is easy to change the tracking code to get the right data that you can use for machine learning, but you can’t change or add data that is already in Google Analytics so it’s important to at least start collecting the data even if you don’t yet have a specific question or challenge that could be answered by machine learning.
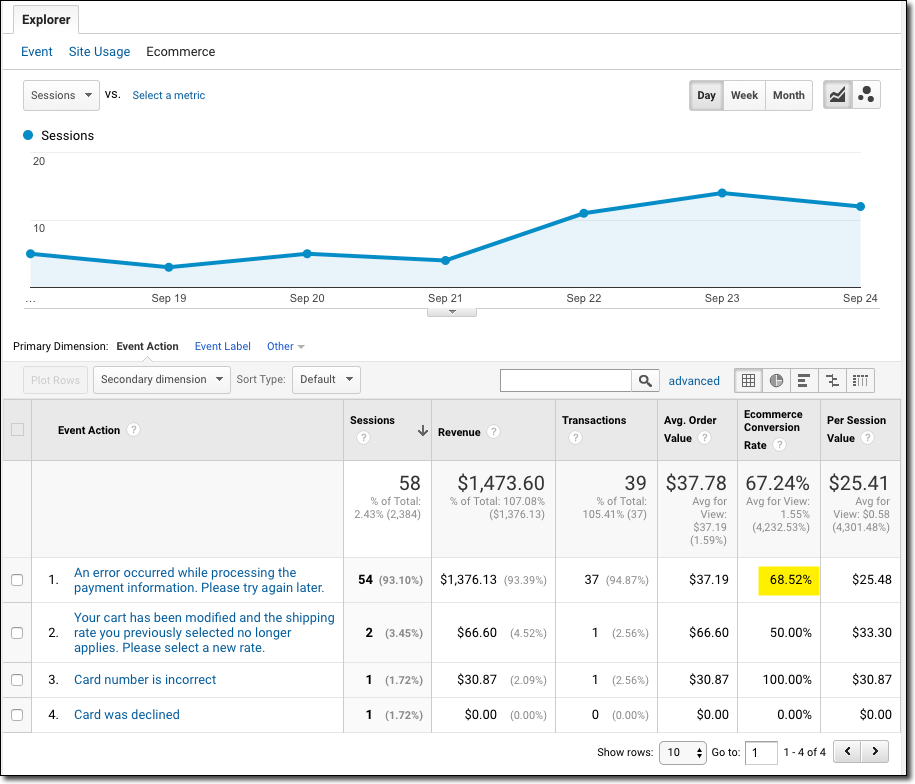
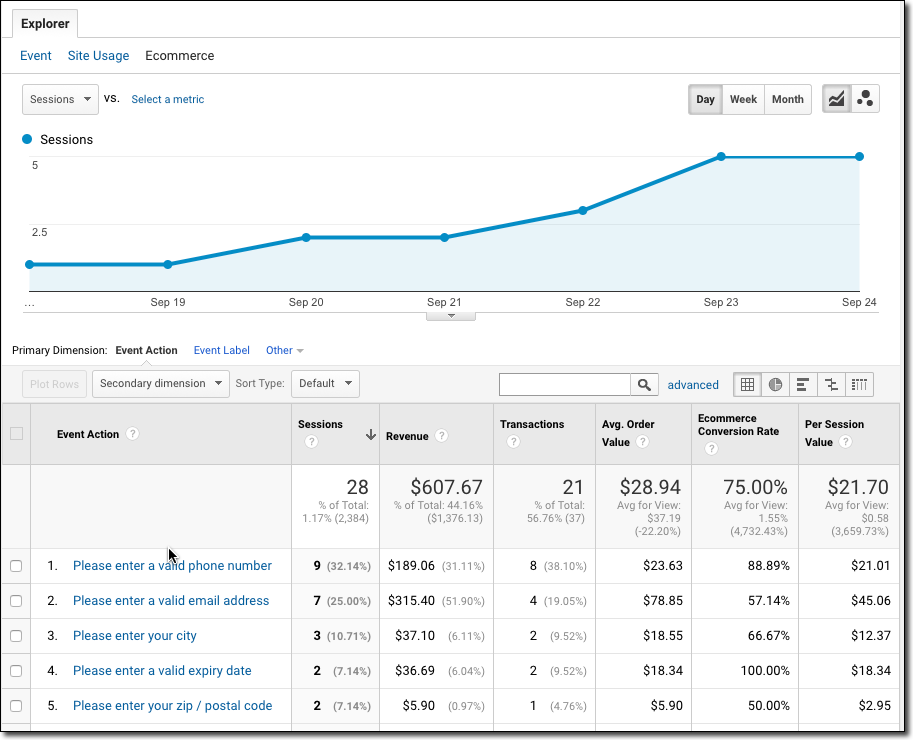
I am pleased to show off our latest addition to our premium tracking service for Analytics Buddy. Now you can track the errors your visitors and customers see as they go through the checkout process, directly in Google Analytics. Are there any confusing form fields on your checkout pages or is your payment gateway having issues causing you to lose valuable sales? Now you can know and take action!
Checkout and Processing Error tracking is now available as part of our Analytics Ninja plan. Please contact us to enable this feature.
There are a few apps that allow you to track the cost of your products, but do they allow you to segment your data? It’s all very well to have a weekly or monthly report of your best products, but what if you want to analyze profit by device type or traffic source? Analytics Buddy automatically sends the product cost at the time of transaction to Google Analytics, giving you access to its awesome segmentation capabilities.
Product cost is a premium Analytics Buddy feature, available for only $7.99/month.
Here is a sample report with some dummy data. You can use the controls at the top of the widget, but there is only data for Aug 1, 2017 to Aug 18, 2017.
We have updated our main reports to include more data points.
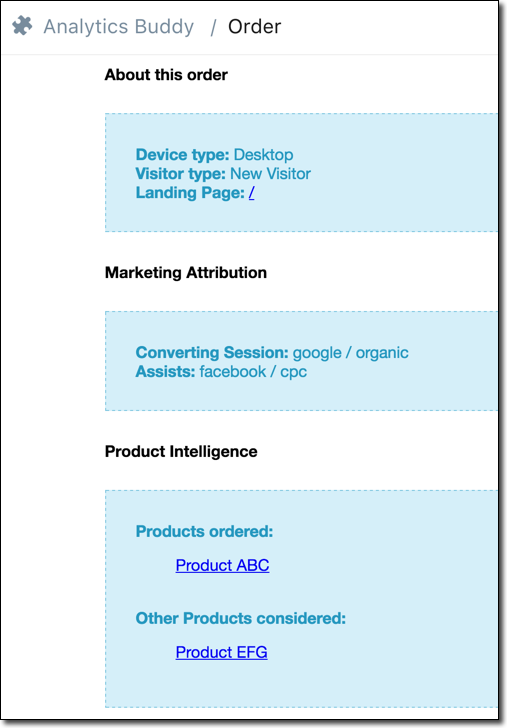
1) Order reports now include device type, visitor type and landing page. As before you’ll know where the order came from, including any hidden assists and if you customer was considering other products to buy.
You can now click through to Products and get more info there:
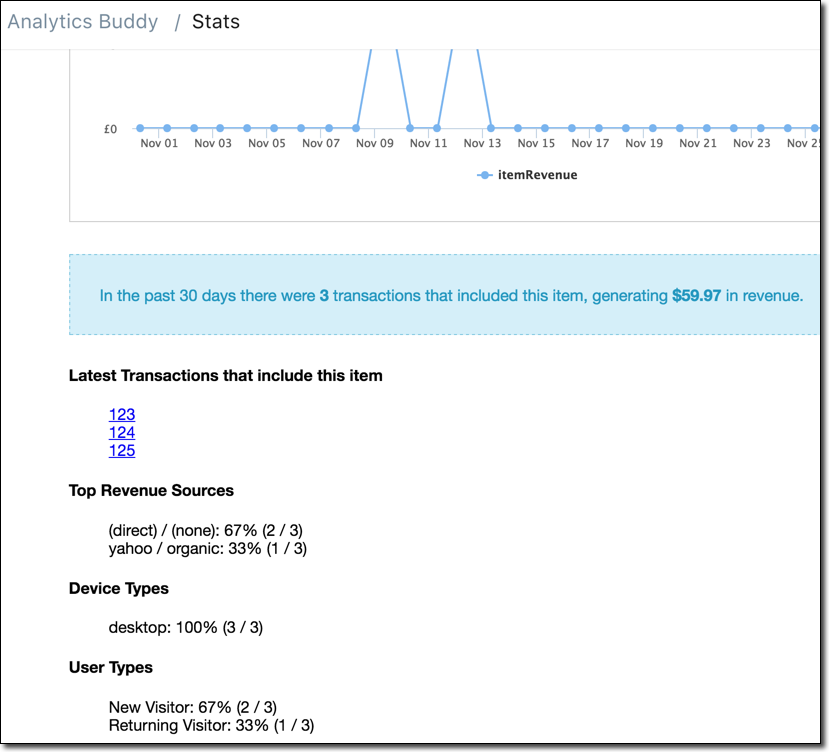
2) Product reports now also include device type, user type and top revenue sources. You’ll still see a graph with the revenue over the past 30 days, along with product views and add to carts. We also show you recent transactions that include that item, making it easier to analyze further: