Data Studio Connector for Shopify
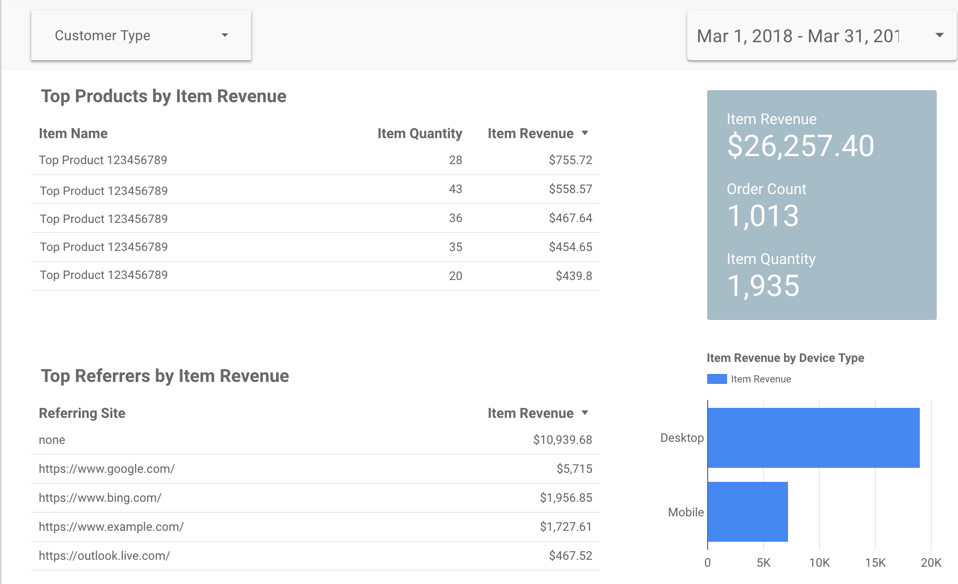
Please take a look at our Data Studio Connector for Shopify. It allows you to create and share Data Studio reports for your Shopify store. Our connector ships with this beautiful template:
To get started, please create a custom app in your Shopify admin.
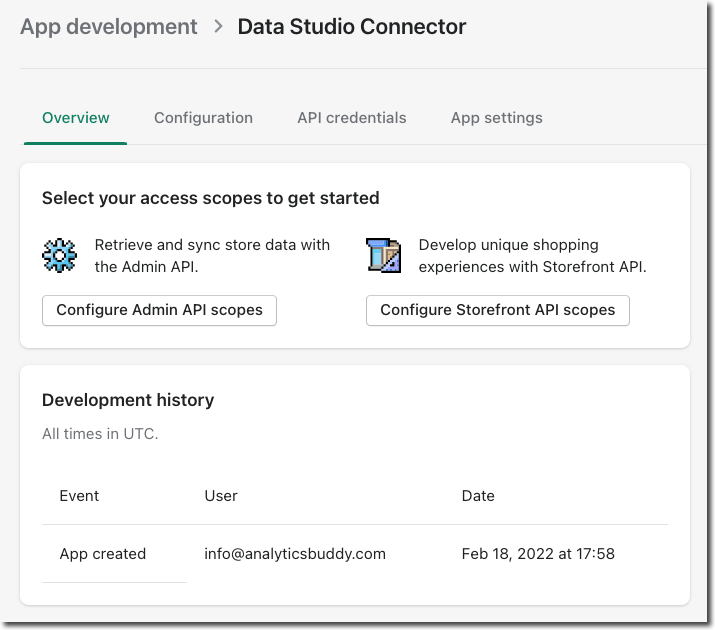
Then click on Configure Admin API scopes. Choose Read permissions for Orders, Products and Customers.
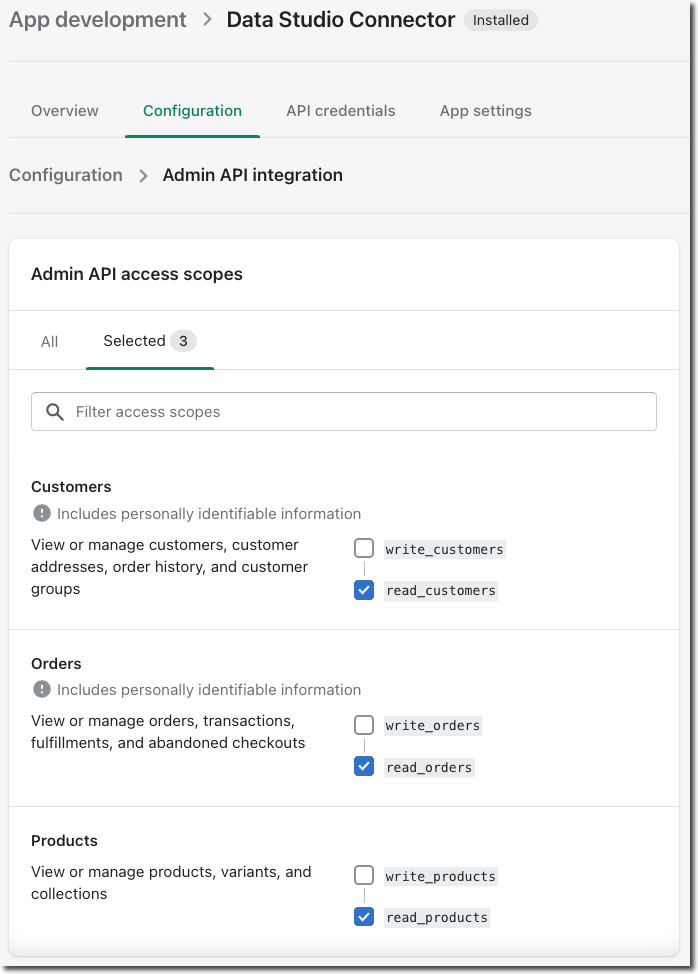
Install the app.
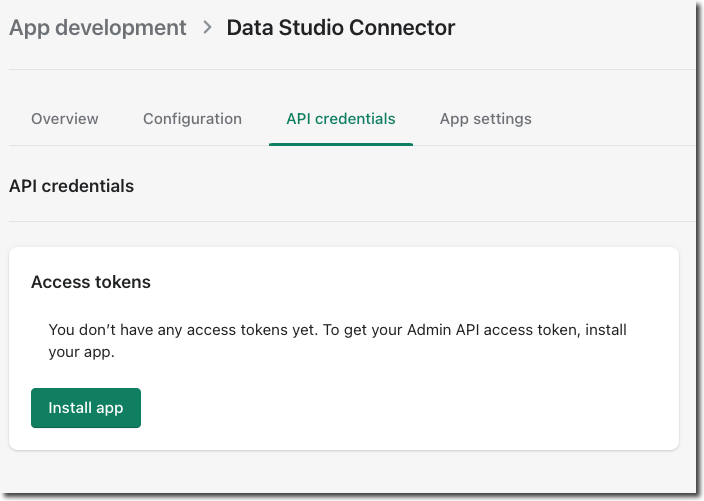
On the next screen you should see the necessary credentials. You'll need the access token, which will only be displayed once:
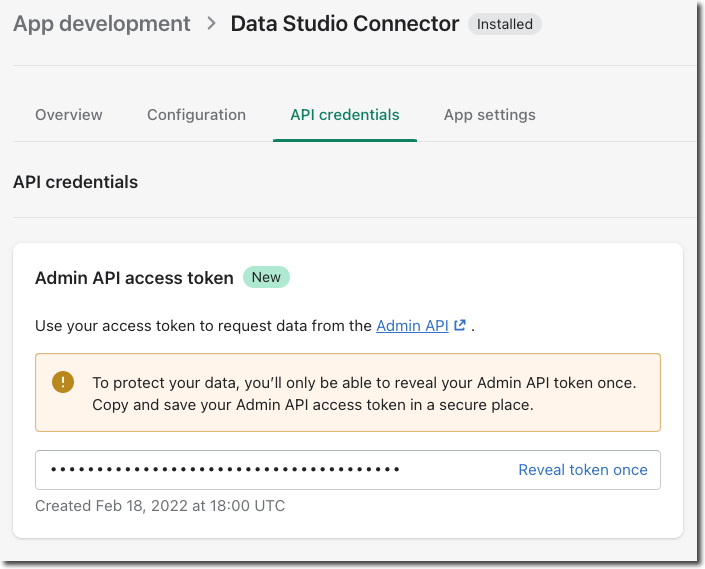
The access token should look like this: shpat_…………….. The Data Studio connector uses a Connection URL that uses this access token and your myshopify domain. It should be in this format:
https://shpat_……………[email protected]
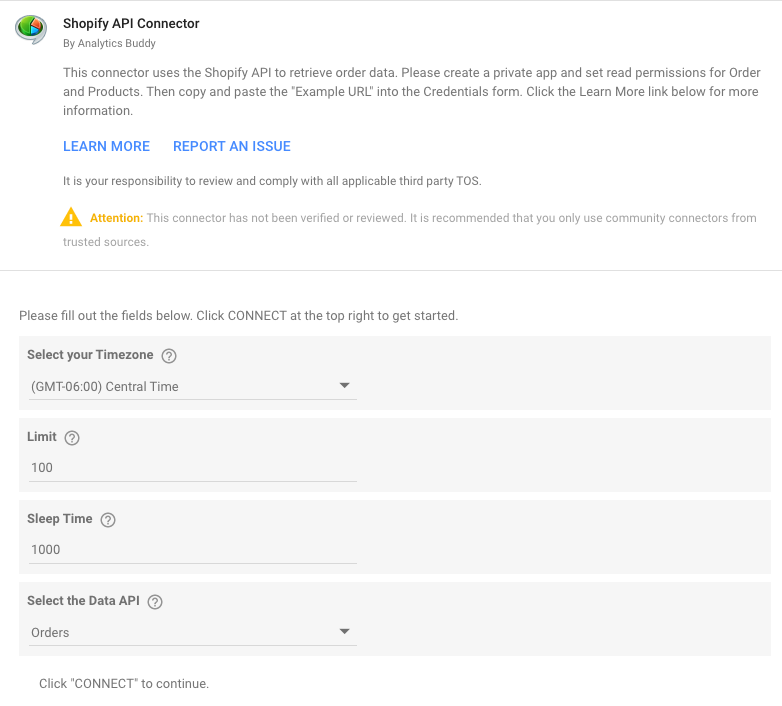
You'll need this Connection Url when you set up the connector. Next, get the connector by clicking here:

Copy the Connection Url and paste it into the Key field. On the next screen enter your Timezone and choose the API. The options for Limit and Sleep Time are used to control the amount of data and how fast the Shopify API is called. If you have a lot of orders and get errors, you may have to reconnect and increase Limit and Sleep Times.
Viewing multiple Shopify stores in the same report
Did you know that you can easily track multiple stores in the same Data Studio report? After you setup the connector for the first time, Data Studio creates a data source that is based on the connector. You can duplicate that data source in your report and use the Connection URL field to connect the other store you want to track. Rename the copied data source so that you can easily identify it when you setup your report. Repeat this process to connect as many stores as you wish. Here is how to do this in detail:
Combine two scorecards into one using data blending
Once you have two data sources in your Data Studio report you can combine the scorecards into one scorecard, for example in order to calculate the total revenue of both stores. Here's how you do it:
Other details:
- In order to get the data from the Shopify API in the right format, it has to be flattened, like a csv file. Since an order can contain multiple items, each line item will be associated with the same order id, name and other data points. For this reason I did not include Order Total as a metric since it would be associated with each line item and summing it would not make sense.
- What does get summed and aggregated is Item Revenue, which is the product of Item Quantity and Item Price. The Item Revenue is likely different than order total because it does not include taxes and shipping costs.
- Many data points are not yet included, so if an important metric or dimension is missing, please let me know.
- Caching is implemented for product images and icons, but not order data in general.
- Sensitive information such as API keys, passwords and order data is never logged.
- This connector is not yet published in the gallery.
Update 3/28/2019:
- Added more data points: Net Sales, Tax, Shipping, Discounts, Open/closed, Active/Cancelled Orders, Refunds*
*Note that refunds are attached to orders. So if you process a refund today for an order that was placed a few days ago, and you run a Data Studio report for today, the refund will not be listed in the report.
Update 6/7/2019:
- Added more data points: Date Hour (so you can break down orders by hour), Basket Size, New Customer ratio, Repeat Customer Ratio
- Added a separate API for Customers.